
Summary
This article is based on the Azure AI Gallery article: Predictive Maintenance Modeling Guide, which includes the data sets used in this article.
However, this notebook is completely implemented on .NET platform using:
- C# Jupyter Notebook,- Jupyter Notebook experience with C# and .NET,
- ML.NET – Microsoft open source framework for machine learning, and
- Daany – DAta ANalYtics open source library for data analytics. It can be installed as Nuget package.
There are small differences between this notebook and the notebooks at the official azure gallery portal, but in most cases, the code follows the steps defined there. The purpose of this notebook is to demonstrate how to use .NET Jupyter Notebook with Daany.DataFrame and ML.NET in order to prepare the data and build the Predictive Maintenance Model on .NET platform. But first lets see what is Predictive Maintenance and why is it important.
Quick Introduction to Predictive Maintenance
Simply speaking it is a technique to determine (predict) the failure of the machine component in the near future so that the component can be replaced based on the maintenance plan before it fails and stop the production process. The Predictive maintenance can improve the production process and increase the productivity. By successfully handling with predictive maintenance we are able to achieve the following goals:
-
reduce the operational risk of mission-critical equipment
-
control cost of maintenance by enabling just-in-time maintenance operations
-
discover patterns connected to various maintenance problems
-
provide Key Performance Indicators.
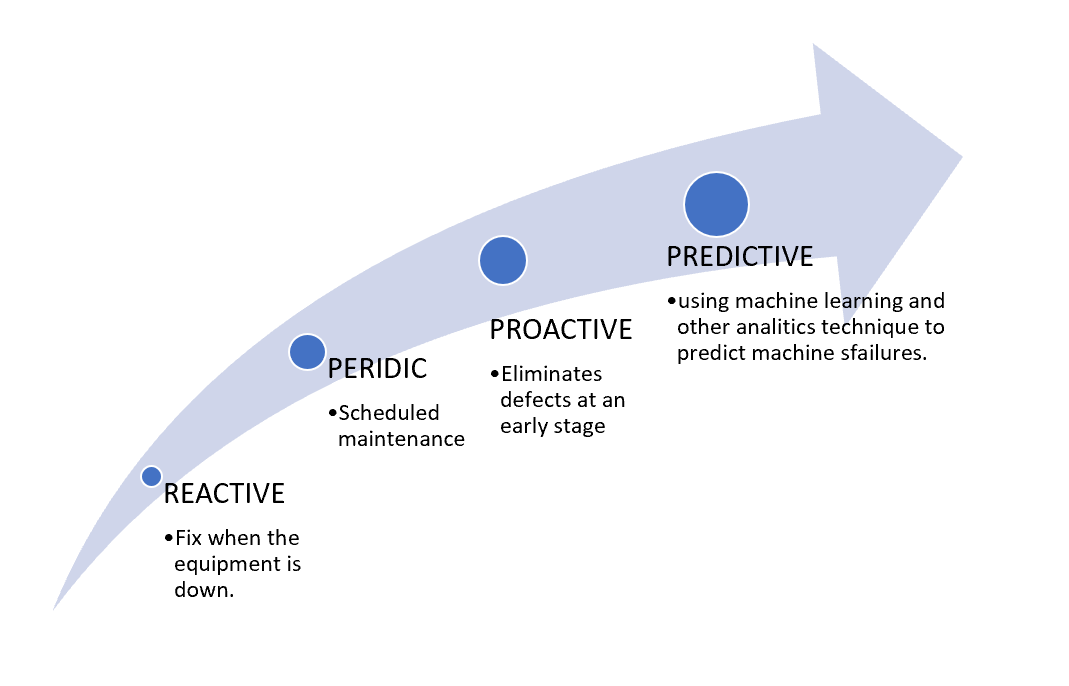
The following image shows different type of maintenance in the production.
Predictive maintenance data collection
In order to handle and use this technique we need a various data from the production, including but not limited to:
- telemetry data from the observed machines (vibration, voltage, temperature etc)
- errors and logs data relevant to each machine,
- failure data, when a certain component is replaced, etc
- quality and accuracy data, machine properties, models, age etc.
3 Steps in Predictive Maintenance
Usually, every Predictive Maintenance technique should proceed by the following 3 main steps:
-
Collect Data – collect all possible descriptions,historical and real-time data, usually by using IOT devices, various loggers, technical documentation, etc.
-
Predict Failures – collected data can be used and transformed into machine learning ready data sets, and build a machine learning model to predict the failures of the components in the set of machines in the production.
-
React – by obtaining the information which components will fail in the near future, we can activate the process of replacement so the component will be replaced before it fails, and the production process will not be interrupted.
Predict Failures
In this article, the second step will be presented, which will be related to data preparation. In order to predict failures in the production process, a set of data transformations, cleaning, feature engineering, and selection must be performed to prepare the data for building a machine learning model. The data preparation part plays a crucially step in the model building since a quality data preparation will directly reflect on the model accuracy and reliability.
Software requirements
In this article, the complete procedure in data preparation is presented. The whole process is performed using:
-
.NET Core 3.1– the latest .NET platform version, -
.NET Jupyter Notebook– .NET implementation of popular Jupyer Notebook, -
ML.NET– Microsoft open-source framework for Machine Learning on .NET Platform and -
Daany– DAta ANalYtics library. It can be found at Github but also as Nuget package.
Notebook preparation
In order to complete this task, we should install several Nuget packages and include several using keywords. The following code block shows the using keywords, and additional code related to notebook output format.
Note: nuget package installation must be in the first cell of the Notebook, otherwise the notebook will not work as expected. Hope this will be changed once the final version would be released.
//using Microsoft.ML.Data;
using XPlot.Plotly;
using System;
using System.Collections.Generic;
using System.Drawing;
using System.Linq;
//using statement of Daany package
using Daany;
using Daany.MathStuff;
using Daany.Ext;
//
using Microsoft.ML;
//DataFrame formatter
using Microsoft.AspNetCore.Html;
Formatter<DataFrame>.Register((df, writer) =>
{
    var headers = new List<IHtmlContent>();
    headers.Add(th(i("index")));
    headers.AddRange(df.Columns.Select(c => (IHtmlContent) th(c)));
    //renders the rows
    var rows = new List<List<IHtmlContent>>();
    var take = 20;
    //
    for (var i = 0; i < Math.Min(take, df.RowCount()); i++)
    {
        var cells = new List<IHtmlContent>();
        cells.Add(td(df.Index[i]));
        foreach (var obj in df[i])
        {
            cells.Add(td(obj));
        }
        rows.Add(cells);
    }
    var t = table(
        thead(headers),
        tbody(rows.Select(r => tr(r))));

    writer.Write(t);
}, "text/html");
Download the data
In order to start with data preparation, we need data. The data can be found at Azure blob storage. The data is maintained by Azure Gallery Article.
Once the data are downloaded from the blob storage, they will not be downloaded again and they will be used as local copies.
The Data
The data we are using for predictive maintenance can be classified to:
telemetry– which collects historical data about machine behavior (voltage, vibration, etc)errors– the data about warnings and errors in the machinesmaint– data about replacement and maintenance for the machines,machines– descriptive information about the machines,failures– data when a certain machine is stopped, due to component failure.
We load all the files in order to fully prepare data for the training process. The following code sample loads the data in to application memory.
%%time
//Load ALL 5 data frame files
//DataFrame Cols: datetime,machineID,volt,rotate,pressure,vibration
var telemetry = DataFrame.FromCsv("data/PdM_telemetry.csv", dformat: "yyyy-mm-dd hh:mm:ss");
var errors = DataFrame.FromCsv("data/PdM_errors.csv", dformat: "yyyy-mm-dd hh:mm:ss");
var maint = DataFrame.FromCsv("data/PdM_maint.csv", dformat: "yyyy-mm-dd hh:mm:ss");
var failures = DataFrame.FromCsv("data/PdM_failures.csv", dformat: "yyyy-mm-dd hh:mm:ss");
var machines = DataFrame.FromCsv("data/PdM_machines.csv", dformat: "yyyy-mm-dd hh:mm:ss");
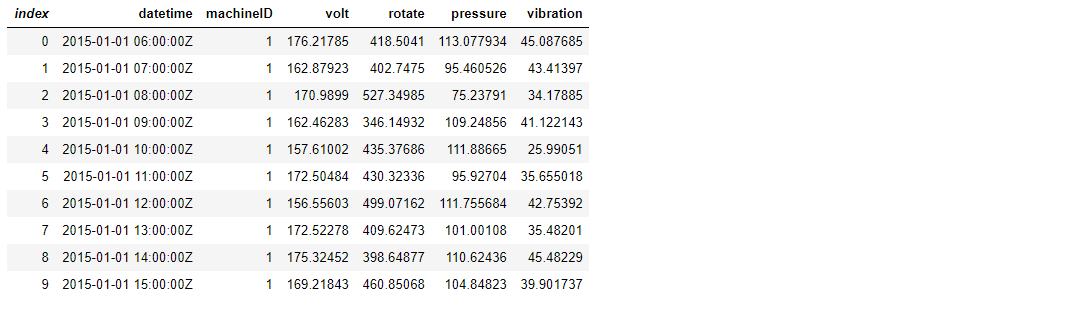
Telemetry
The first data source is the telemetry data about machines. It consists of
voltage, rotation, pressure, and vibration measurements measured from
100 machines in real-time hourly. The time period the data has been collected is
during the year 2015. The following data shows the first 10 records in the
dataset.
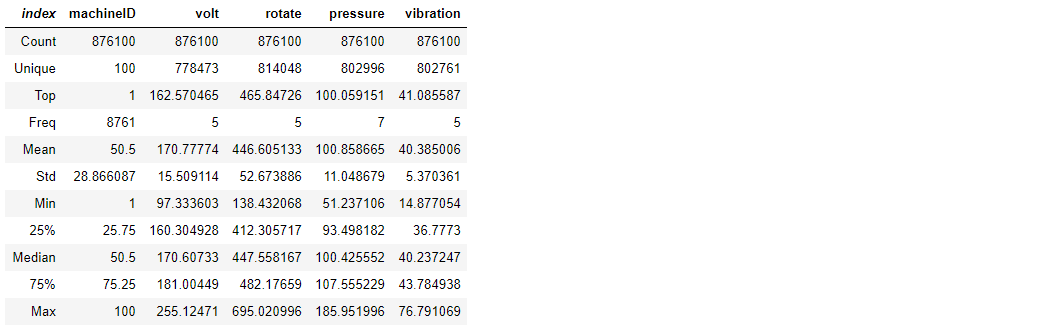
A description of the whole dataset is shown on the next cell. As can be seen, we have nearly million records for the machines, which is good starting point for the analysis.
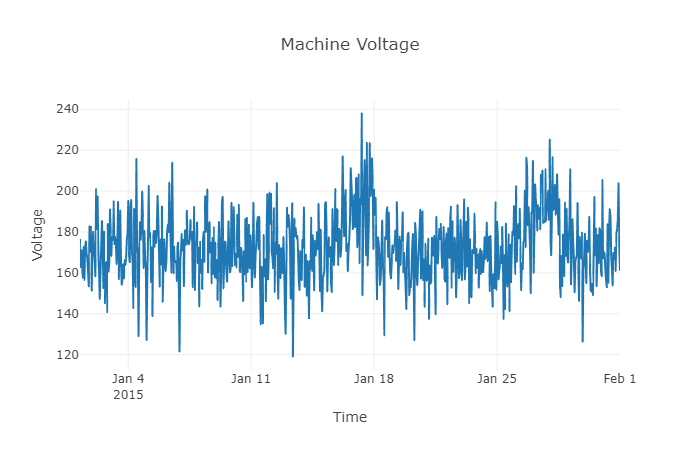
In case we want to see the visualization of the telemetry data, we can select on of several column and show it.
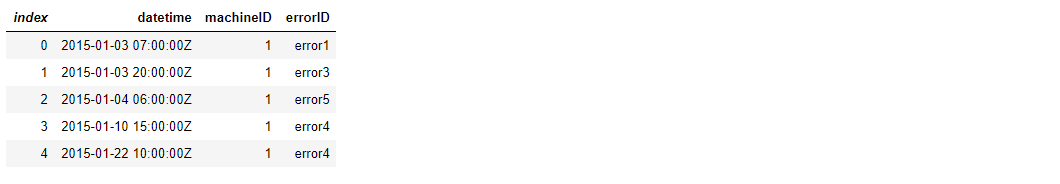
Errors
One of the most important information in every Predictive Maintenance system is Error data. Actually errors are non-breaking recorded events while the machine is still operational. The error date and times are rounded to the closest hour since the telemetry data is collected at an hourly rate.
errors.Head()
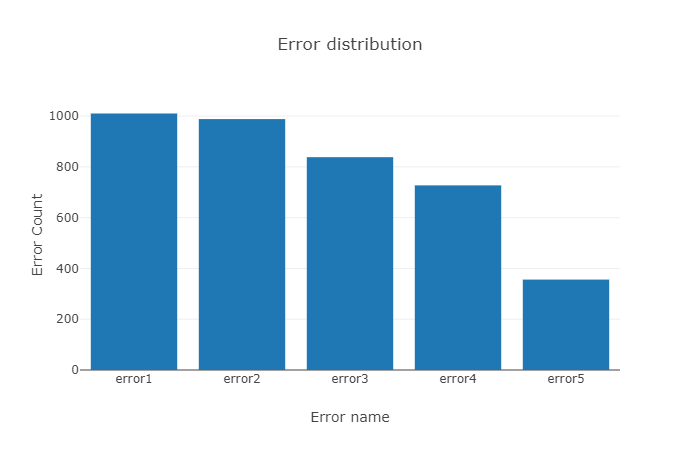
//count number of errors
var barValue = errors["errorID"].GroupBy(v => v)
        .OrderBy(group => group.Key)
        .Select(group => Tuple.Create(group.Key, group.Count()));

//Plot Errors data
var chart = Chart.Plot(
    new Graph.Bar()
    {
       x = barValue.Select(x=>x.Item1),
       y = barValue.Select(x=>x.Item2),
      //  mode = "markers",
    }

);
var layout = new XPlot.Plotly.Layout.Layout()
    { title = "Error distribution",
     xaxis=new XPlot.Plotly.Graph.Xaxis() { title="Error name" },
     yaxis = new XPlot.Plotly.Graph.Yaxis() { title = "Error Count" } };
//put layout into chart
chart.WithLayout(layout);

display(chart)
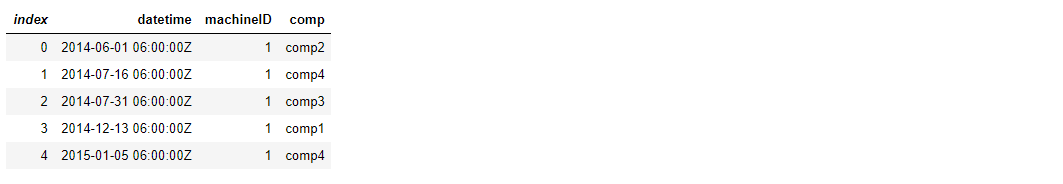
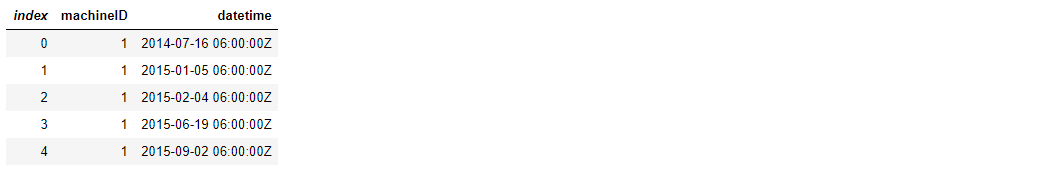
Maintenance
The Maintenance is the next PrM component which tells us about scheduled and
unscheduled maintenance. The maintenance contains the records which correspond
to both regular inspection of components as well as failures. To add the record
into the maintenance table a component must be replaced during the scheduled
inspection or replaced due to a breakdown. In case the records are created due
to breakdowns are called failures. Maintenance contains the data from 2014 and
2015 years.
maint.Head()
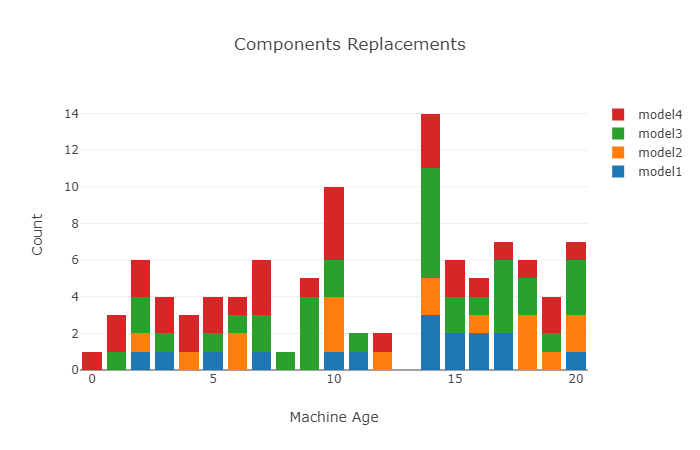
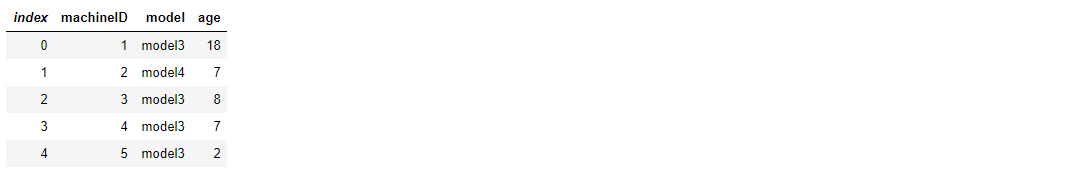
Machines
The data include information about 100 machines which are subject of the
Predictive Maintenance analysis. The information includes: model type, and
machine age. Distribution of the machine age categorized by the models across production process is shown in the following image:
//Distribution of models across age
var d1 = machines.Filter("model", "model1", FilterOperator.Equal)["age"]
                                    .GroupBy(g => g).Select(g=>(g.Key,g.Count()));
var d2 = machines.Filter("model", "model2", FilterOperator.Equal)["age"]
                                    .GroupBy(g => g).Select(g=>(g.Key,g.Count()));
var d3 = machines.Filter("model", "model3", FilterOperator.Equal)["age"]
                                    .GroupBy(g => g).Select(g=>(g.Key,g.Count()));
var d4 = machines.Filter("model", "model4", FilterOperator.Equal)["age"]
                                    .GroupBy(g => g).Select(g=>(g.Key,g.Count()));
//define bars
var b1 = new Graph.Bar(){ x = d1.Select(x=>x.Item1),y = d1.Select(x=>x.Item2),name = "model1"};
var b2 = new Graph.Bar(){ x = d2.Select(x=>x.Item1),y = d2.Select(x=>x.Item2),name = "model2"};
var b3 = new Graph.Bar(){ x = d3.Select(x=>x.Item1),y = d3.Select(x=>x.Item2),name = "model3"};
var b4 = new Graph.Bar(){ x = d4.Select(x=>x.Item1),y = d4.Select(x=>x.Item2),name = "model4"};

//Plot machine data
var chart = Chart.Plot(new[] {b1,b2,b3,b4});
var layout = new XPlot.Plotly.Layout.Layout()
    { title = "Components Replacements",barmode="stack",
     xaxis=new XPlot.Plotly.Graph.Xaxis() { title="Machine Age" },
     yaxis = new XPlot.Plotly.Graph.Yaxis() { title = "Count" } };
//put layout into chart
chart.WithLayout(layout);

display(chart)
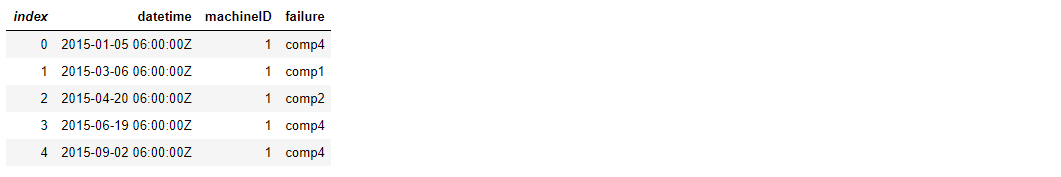
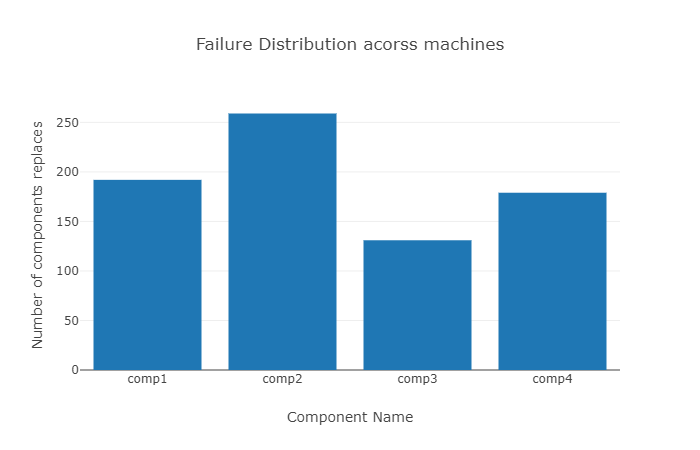
Failures
The Failures data represent the replacements of the components due to the failure of
the machines. Once the failure is happened the machine is stopped. This is a
crucial difference between Errors and Failures.
failures.Head()
//count number of failures
var falValues = failures["failure"].GroupBy(v => v)
        .OrderBy(group => group.Key)
        .Select(group => Tuple.Create(group.Key, group.Count()));

//Plot Failure data
var chart = Chart.Plot(
    new Graph.Bar()
    {
       x = falValues.Select(x=>x.Item1),
       y = falValues.Select(x=>x.Item2),
      //  mode = "markers",
    }

);
var layout = new XPlot.Plotly.Layout.Layout()
    { title = "Failure Distribution across machines",
     xaxis=new XPlot.Plotly.Graph.Xaxis() { title="Component Name" },
     yaxis = new XPlot.Plotly.Graph.Yaxis() { title = "Number of components replaces" } };
//put layout into chart
chart.WithLayout(layout);

display(chart)
Feature Engineering
This section contains several feature engineering methods used to create features based on the machines’ properties.
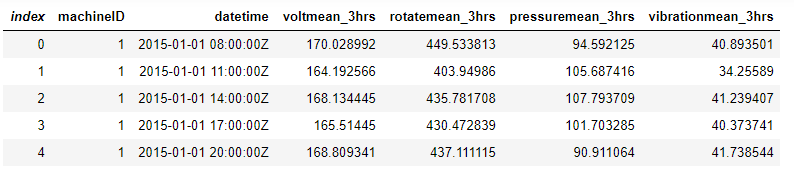
Lagged Telemetry Features
First, we are going to create several lagged telemetry data, since telemetry data are classic time series data.
In the following, the rolling mean and standard deviation of the telemetry data over the last 3-hours lag window is calculated for every 3 hours.
//prepare rolling aggregation for each column for average values
var agg_curent = new Dictionary<string, Aggregation>()
 {
    { "datetime", Aggregation.Last }, { "volt", Aggregation.Last }, { "rotate", Aggregation.Last },
    { "pressure", Aggregation.Last },{ "vibration", Aggregation.Last }
  };
//prepare rolling aggregation for each column for average values
var agg_mean = new Dictionary<string, Aggregation>()
 {
    { "datetime", Aggregation.Last }, { "volt", Aggregation.Avg }, { "rotate", Aggregation.Avg },
    { "pressure", Aggregation.Avg },{ "vibration", Aggregation.Avg }
  };
//prepare rolling aggregation for each column for std values
var agg_std = new Dictionary<string, Aggregation>()
{
   { "datetime", Aggregation.Last }, { "volt", Aggregation.Std }, { "rotate", Aggregation.Std },
    { "pressure", Aggregation.Std },{ "vibration", Aggregation.Std }
};
//group Telemetry data by machine ID
var groupedTelemetry = telemetry.GroupBy("machineID");
//calculate rolling mean for grouped data for each 3 hours
var _3AvgValue = groupedTelemetry.Rolling(3, 3, agg_mean)
                 .Create(("machineID", null), ("datetime", null),("volt", "voltmean_3hrs"), ("rotate", "rotatemean_3hrs"),
                         ("pressure", "pressuremean_3hrs"), ("vibration", "vibrationmean_3hrs"));
//show head of the newely generated table
_3AvgValue.Head()
//calculate rolling std for grouped datat fro each 3 hours
var _3StdValue = groupedTelemetry.Rolling(3, 3, agg_mean)
                 .Create(("machineID", null), ("datetime", null),("volt", "voltsd_3hrs"), ("rotate", "rotatesd_3hrs"),
                         ("pressure", "pressuresd_3hrs"), ("vibration", "vibrationsd_3hrs"));
//show head of the new generated table
_3StdValue.Head()
For capturing a longer term effect 24 hours lag features we are going to calculate rolling avg and std.
//calculate rolling avg and std for each 24 hours
var _24AvgValue = groupedTelemetry.Rolling(24, 3, agg_mean)
                .Create(("machineID", null), ("datetime", null),
                        ("volt", "voltmean_24hrs"), ("rotate", "rotatemean_24hrs"),
                        ("pressure", "pressuremean_24hrs"), ("vibration", "vibrationmean_24hrs"));
var _24StdValue = groupedTelemetry.Rolling(24, 3, agg_std)
                .Create(("machineID", null), ("datetime", null),
                        ("volt", "voltsd_24hrs"), ("rotate", "rotatesd_24hrs"),
                        ("pressure", "pressuresd_24hrs"), ("vibration", "vibrationsd_24hrs"));
Merging telemetry features
Once we have rolling lag features calculated, we can merge them into one data frame:
//before merge all features create set of features from the current values for every 3 or 24 hours
DataFrame _1CurrentValue = groupedTelemetry.Rolling(3, 3, agg_curent)
                            .Create(("machineID", null), ("datetime", null),
                            ("volt", null), ("rotate", null), ("pressure", null), ("vibration", null));
Now that we have basic data frame merge previously calculated data frames with this one.
//merge all telemetry data frames into one
var mergeCols= new string[] { "machineID", "datetime" };
var df1 = _1CurrentValue.Merge(_3AvgValue, mergeCols, mergeCols, JoinType.Left, suffix: "df1");

var df2 = df1.Merge(_24AvgValue, mergeCols, mergeCols, JoinType.Left, suffix: "df2");

var df3 = df2.Merge(_3StdValue, mergeCols, mergeCols, JoinType.Left, suffix: "df3");

var df4 = df3.Merge(_24StdValue, mergeCols, mergeCols, JoinType.Left, suffix: "df4");
At the end of the merging process, select relevant columns.
//select final dataset for the telemetry
var telDF = df4["machineID","datetime","volt","rotate", "pressure", "vibration",
"voltmean_3hrs","rotatemean_3hrs","pressuremean_3hrs","vibrationmean_3hrs",
"voltmean_24hrs","rotatemean_24hrs","pressuremean_24hrs","vibrationmean_24hrs",
"voltsd_3hrs", "rotatesd_3hrs","pressuresd_3hrs","vibrationsd_3hrs",
"voltsd_24hrs", "rotatesd_24hrs","pressuresd_24hrs","vibrationsd_24hrs"];
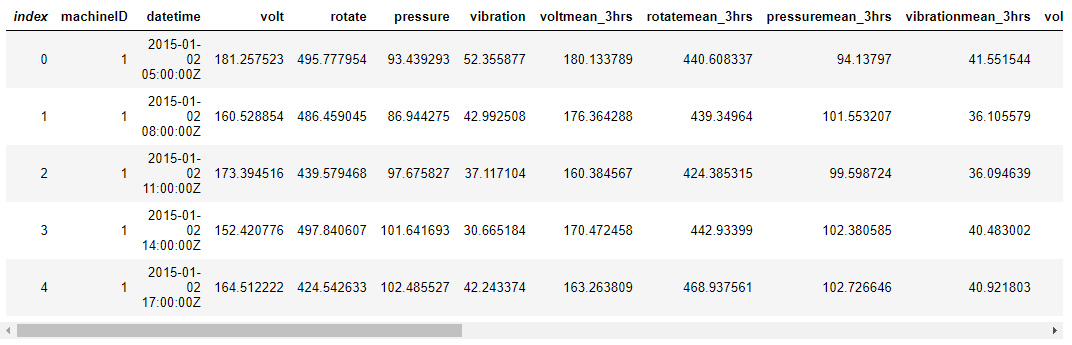
//remove NANs
var telemetry_final = telDF.DropNA();
Now top 5 rows of final telemetry data looks like the following image:
telemetry_final.Head()
Lag Features from Errors
Unlike telemetry that had numerical values, errors have categorical values denoting the type of error that occurred at a time-stamp. We are going to aggregate categories of the error with different types of errors that occurred in the lag window.
First, encode the errors with One-Hot-Encoding:
var mlContext = new MLContext(seed:2019);
//One Hot Encoding of error column
var encodedErr = errors.EncodeColumn(mlContext, "errorID");
//sum duplicated errors by machine and date
var errors_aggs = new Dictionary<string, Aggregation>();
errors_aggs.Add("error1", Aggregation.Sum);
errors_aggs.Add("error2", Aggregation.Sum);
errors_aggs.Add("error3", Aggregation.Sum);
errors_aggs.Add("error4", Aggregation.Sum);
errors_aggs.Add("error5", Aggregation.Sum);
//group and sum duplicated errors
encodedErr = encodedErr.GroupBy(new string[] { "machineID", "datetime" }).Aggregate(errors_aggs);
//
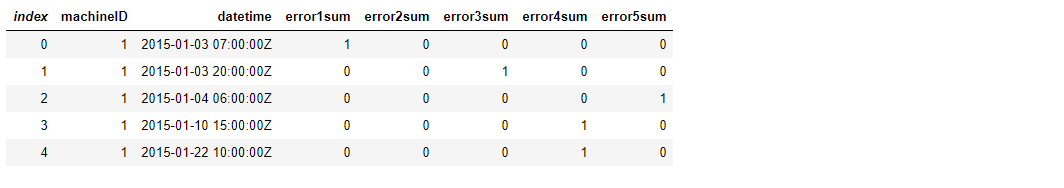
encodedErr = encodedErr.Create(("machineID", null), ("datetime", null),
("error1", "error1sum"), ("error2", "error2sum"),
("error3", "error3sum"), ("error4", "error4sum"), ("error5", "error5sum"));
encodedErr.Head()
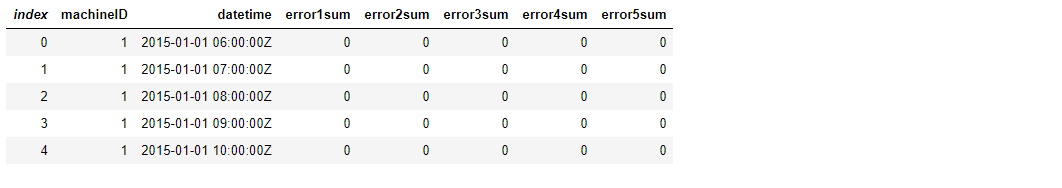
// align errors with telemetry datetime values so that we can calculate aggregations
var er = telemetry.Merge(encodedErr,mergeCols, mergeCols, JoinType.Left, suffix: "error");
//
er = er["machineID","datetime", "error1sum", "error2sum", "error3sum", "error4sum", "error5sum"];
//fill missing values with 0
er.FillNA(0);
er.Head()
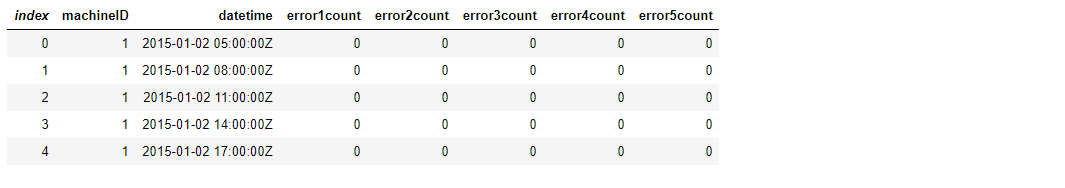
//count the number of errors of different types in the last 24 hours, for every 3 hours
//define aggregation
var errors_aggs1 = new Dictionary<string, Aggregation>()
{
  { "datetime", Aggregation.Last },{ "error1sum", Aggregation.Sum }, { "error2sum", Aggregation.Sum },
  { "error3sum", Aggregation.Sum },{ "error4sum", Aggregation.Sum },
  { "error5sum", Aggregation.Sum }
};

//count the number of errors of different types in the last 24 hours,  for every 3 hours
var eDF = er.GroupBy(new string[] { "machineID"}).Rolling(24, 3, errors_aggs1);

//
var newdf=  eDF.DropNA();

var errors_final = newdf.Create(("machineID", null), ("datetime", null),
                        ("error1sum", "error1count"), ("error2sum", "error2count"),
                        ("error3sum", "error3count"), ("error4sum", "error4count"), ("error5sum", "error5count"));
errors_final.Head()
The Time Since Last Replacement
As the main task here is how to create a relevant feature in order to create a quality data set for the machine learning part. One of the good features would be the number of replacements of each component in the last 3 months to incorporate the frequency of replacements.
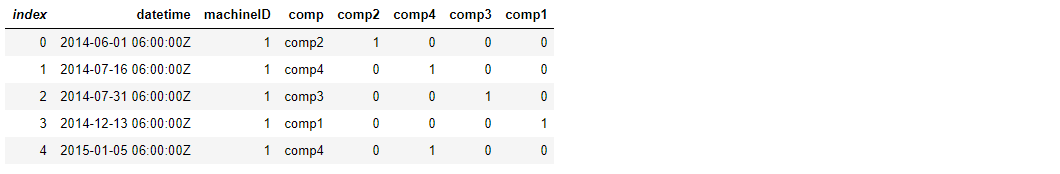
Furthermore, we can calculate how long it has been since a component is last replaced as that would be expected to correlate better with component failures since the longer a component is used, the more degradation should be expected. As first we are going to encode the maintenance table:
//One Hot Encoding of error column
var encMaint = maint.EncodeColumn(mlContext, "comp");
encMaint.Head()
//create separate data frames in order to calculate proper time since last replacement
DataFrame dfComp1 = encMaint.Filter("comp1", 1, FilterOperator.Equal)["machineID", "datetime"];
DataFrame dfComp2 = encMaint.Filter("comp2", 1, FilterOperator.Equal)["machineID", "datetime"];;
DataFrame dfComp3 = encMaint.Filter("comp3", 1, FilterOperator.Equal)["machineID", "datetime"];;
DataFrame dfComp4 = encMaint.Filter("comp4", 1, FilterOperator.Equal)["machineID", "datetime"];;

dfComp4.Head()
//from telemetry data create helped data frame so we can calculate additional column from the maintenance data frame
var compData = telemetry_final.Create(("machineID", null), ("datetime", null));
%%time
//calculate new set of columns so that we have information the time since last replacement of each component separately
var newCols= new string[]{"sincelastcomp1","sincelastcomp2","sincelastcomp3","sincelastcomp4"};
var calcValues= new object[4];

//perform calculation
compData.AddCalculatedColumns(newCols,(row, i)=>
{
    var machineId = Convert.ToInt32(row["machineID"]);
    var date = Convert.ToDateTime(row["datetime"]);

    var maxDate1 = dfComp1.Filter("machineID", machineId, FilterOperator.Equal)["datetime"]
        .Where(x => (DateTime)x <= date).Select(x=>(DateTime)x).Max();
    var maxDate2 = dfComp2.Filter("machineID", machineId, FilterOperator.Equal)["datetime"]
        .Where(x => (DateTime)x <= date).Select(x=>(DateTime)x).Max();
    var maxDate3 = dfComp3.Filter("machineID", machineId, FilterOperator.Equal)["datetime"]
        .Where(x => (DateTime)x <= date).Select(x=>(DateTime)x).Max();
    var maxDate4 = dfComp4.Filter("machineID", machineId, FilterOperator.Equal)["datetime"]
        .Where(x => (DateTime)x <= date).Select(x=>(DateTime)x).Max();

    //perform calculation
    calcValues[0] = (date - maxDate1).TotalDays;
    calcValues[1] = (date - maxDate2).TotalDays;
    calcValues[2] = (date - maxDate3).TotalDays;
    calcValues[3] = (date - maxDate4).TotalDays;
    return calcValues;
});
Wall time: 178708.9764ms

var maintenance_final = compData;
maintenance_final.Head()
Machine Features
The machine data set contains descriptive information about machines like the type of machines and their ages which is the years in service.
machines.Head()
Joining features into final ML ready data set
As the last step in Feature engineering, we are performing merging all features into one data set.
var merge2Cols=new string[]{"machineID"};
var fdf1= telemetry_final.Merge(errors_final, mergeCols, mergeCols,JoinType.Left, suffix: "er");
var fdf2 = fdf1.Merge(maintenance_final, mergeCols,mergeCols,JoinType.Left, suffix: "mn");
var features_final = fdf2.Merge(machines, merge2Cols,merge2Cols,JoinType.Left, suffix: "ma");
features_final= features_final["datetime", "machineID",
            "voltmean_3hrs", "rotatemean_3hrs", "pressuremean_3hrs", "vibrationmean_3hrs",
            "voltstd_3hrs", "rotatestd_3hrs", "pressurestd_3hrs", "vibrationstd_3hrs",
            "voltmean_24hrs", "rotatemean_24hrs", "pressuremean_24hrs", "vibrationmean_24hrs",
            "voltstd_24hrs","rotatestd_24hrs", "pressurestd_24hrs", "vibrationstd_24hrs",
            "error1count", "error2count", "error3count", "error4count", "error5count",
            "sincelastcomp1", "sincelastcomp2", "sincelastcomp3", "sincelastcomp4",
            "model", "age"];
//

features_final.Head();
DataFrame.ToCsv("data/final_features.csv", features_final);
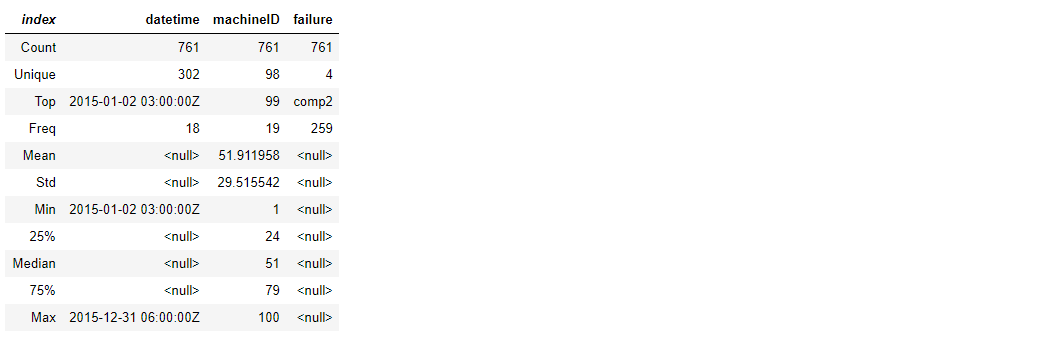
Define Label Column
The Label in prediction maintenance should be the probability that a machine will fail in the near future due to a failure certain component. If we take 24 hours to be a task for this problem, the label construction is consists of a new column in the feature data set which indicate if certain machine will fail or not in the next 24 hours due to failure one of several components.
With this way we are defining the label as a categorical variable containing: –
none – if the machine will not fail in the next 24 hours, – comp1 to comp4
- if the machine will fail in the next 24 hours due to the failure of certain components.
Since we can experiment with the label construction by applying different conditions, we can implement methods that take several arguments in order to define the general problem.
failures.Describe(false)
//constructing the label column which indicate if the current machine will
//fail in the next `predTime` (24 hours as default) due to failur certain component.
//create final data frame from feature df
var finalDf = new DataFrame(features_final);

//group failures by machineID and datetime
string[] cols = new string[] {  "machineID" , "datetime"};
var failDfgrp = failures.GroupBy(cols);

//Add failure column to  finalDF
var rV = new object[] { "none" };
finalDf.AddCalculatedColumns(new string[]{"failure"}, (object[] row, int i) => rV);

//create new data frame from featuresDF by grouping machineID and datatime
var featureDfGrouped = finalDf["datetime","machineID", "failure"].GroupBy(cols);

//now look for every failure and calculate if the machine will fail in the last 24 hours
//in case two or more components were failed for the ssame machine add new row in df
var failureDfExt = featureDfGrouped.Transform((xdf) =>
{
    //extract the row from featureDfGrouped
    var xdfRow = xdf[0].ToList();
    var refDate = (DateTime)xdfRow[0];
    var machineID = (int)xdfRow[1];

    //now look if the failure contains the machineID
    if(failDfgrp.Group2.ContainsKey(machineID))
    {
        //get the date and calculate total hours
        var dff = failDfgrp.Group2[machineID];

        foreach (var dfff in dff)
        {
            for (int i = 0; i < dfff.Value.RowCount(); i++)
            {
                //"datetime","machineID","failure"
                var frow = dfff.Value[i].ToList();
                var dft = (DateTime)frow[0];

                //if total hours is less or equal than 24 hours set component to the failure column
                var totHours = (dft - refDate).TotalHours;
                if (totHours <= 24 && totHours >=0)
                {
                    if (xdf.RowCount() > i)
                        xdf["failure", i] = frow[2];
                    else//in case two components were failed for the same machine and
                        //at the same time, add new row with new component name
                    {
                        var r = xdf[0].ToList();
                        r[2] = frow[2];
                        xdf.AddRow(r);
                    }
                }
            }
        }
    }
    return xdf;
});

//Now merge extended failure Df with featureDF
var final_dataframe = finalDf.Merge(failureDfExt, cols, cols,JoinType.Left, "fail");

//define final set of columns
final_dataframe = final_dataframe["datetime", "machineID",
"voltmean_3hrs", "rotatemean_3hrs", "pressuremean_3hrs", "vibrationmean_3hrs",
"voltsd_3hrs", "rotatesd_3hrs", "pressuresd_3hrs", "vibrationsd_3hrs",
"voltmean_24hrs", "rotatemean_24hrs", "pressuremean_24hrs", "vibrationmean_24hrs",
"voltsd_24hrs", "rotatesd_24hrs", "pressuresd_24hrs", "vibrationsd_24hrs",
"error1count", "error2count", "error3count", "error4count", "error5count",
"sincelastcomp1", "sincelastcomp2", "sincelastcomp3", "sincelastcomp4",
"model", "age", "failure_fail"];

//rename column
final_dataframe.Rename(("failure_fail", "failure"));
//save the file data frame to disk
DataFrame.ToCsv("data/final_dataFrame.csv",final_dataframe);
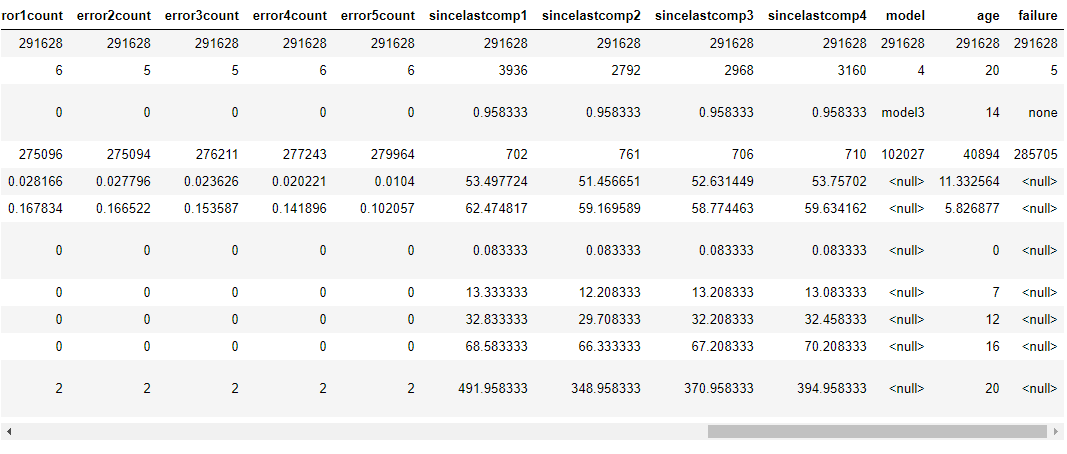
Final Data Frame
Lets see how the final_dataframe looks like. It contains 24
columns. Most of the columns are numerical. The Model column is categorical
and it should be encoded once we prepare the machine learning part.
Also the label column failure is categorical column containing 5 different
categories: none, comp1, comp2, comp3 and comp4. We can also see the
data set is not balance, since we have 2785705 none and the rest of the rows
in total of 5923 other categories. This is typical unbalanced dataset, and we
should be careful when evaluation models, because the model which returns
always none value will have more than 97% of accuracy.
final_dataframe.Describe(false)
In the next part, we are going to implement the training and evaluation process of the Predictive Maintenance model. The full notebook for this blog post can be found here

Hello Bahrudin. I am curious about the second part. Do you have it already setup? How the trainning and evaluation of the model would be implemented? Thanks a lot for any feedback. Your article is very useful. I would love to see it implemented in Jupyter Notebook.
Hi Marek,
thank you for the interest about my PrM article.
Sure, the second part is going on.
My comment is related to the Predictive maintenance example article you have posted …
Pingback: Building Predictive Maintenance Model Using ML.NET | Bahrudin Hrnjica Blog